من الضروري جدا نشر هكذا مواضيع تعليمة في منتدى اللغة الانكليزية
How to draw a flowchart
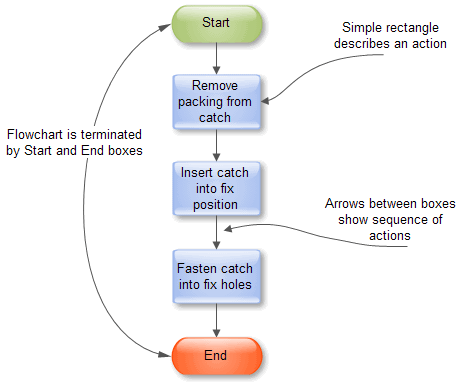
Are you confused on how to draw a flow chart? Here are some guidelines which can be used to ease the process of understanding the system and its flow.Most of us don't know how to deal with flow charts when we are novice users but with the passage of time and experience we gain expertise. A good flow chart helps to understand the systematic flow of information in the system. If a flow chart is not created properly then it may mislead the designer of the system or may result in fatigue consequences. Therefore, it is very important that you create flow chart with caution and expertise. I would always suggest you to use flow chart to ease the process of understanding the system and its flow.Although there are many symbols that can be used in flowcharts to represent different kinds of steps, accurate flowcharts can be created using very few (e.g. Process, Decision, Start, delay, cloud).The basic element of a flowchart is a simple action, which can be anything from striking an anvil to making a cash payment, and is represented as a box containing a description of the action. The mapping of 'what follows what' is shown with arrows between sequential action boxes, as in the illustration. This also shows the boxes for flowchart start and end points of which there are normally one each.
Fig. 1. Basic Flowchart elements
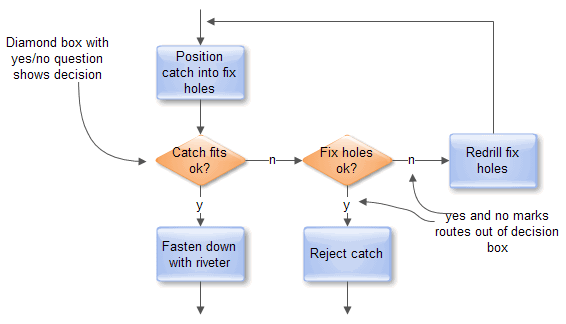
Processes become more complex when decisions must be made on which, out of an alternative set of actions, must be taken. The decision is shown in a Flowchart as a diamond-shaped box containing a simple question to which the answer is 'yes' or 'no' as in Fig. 2. More complex decisions are made up of combinations of simple decision boxes.
Fig. 2. Decisions in Flowcharts
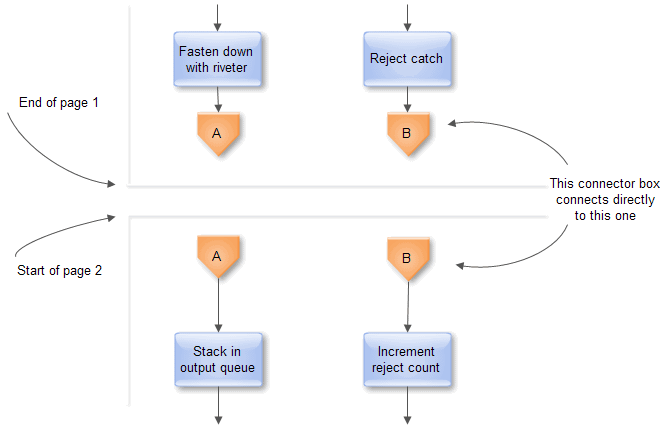
Processes often go wrong around decisions, as either the wrong question is being asked or the wrong answer is being given.Where boxes cannot be directly connected with lines, the separated lines are coordinated with connector boxes containing matching names. This typically occurs where lines cross onto another page, as in the illustration.
Fig. 3. Continuing Flowcharts across pages
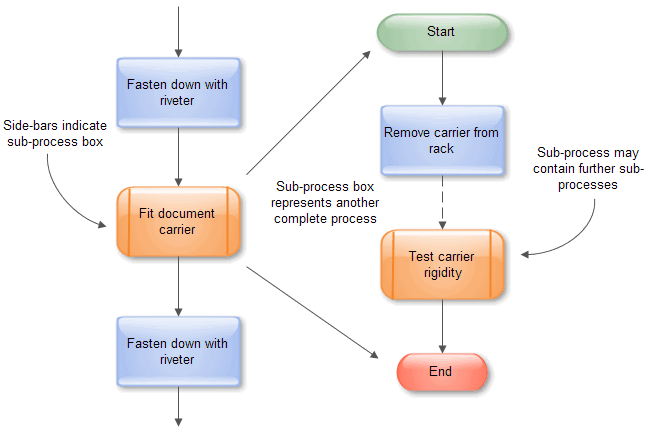
By using multiple connector boxes, it is very easy for flowcharts to become very large, although this is usually self-defeating, as the Flowchart then becomes difficult to understand. The ideal size for a Flowchart is one page, as this gives a single visual 'chunk' that is reasonably easy to understand as a single item.Large processes can be broken down into a hierarchical set of smaller Flowcharts by representing a lower level process as a single sub-process box. This behaves like a normal action box at the higher level, but can be 'zoomed into' to expose another Flowchart, as in Fig. 4.
Fig. 4. Sub processes
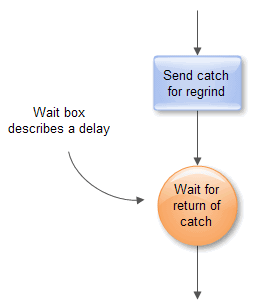
An additional 'action' box that can be useful when analyzing processes is the wait box, which highlights a delay (i.e. no action), as in the illustration. This is a typical point where the overall cost of a process may be improved by acting, possibly on other processes, to reduce the delay.
Fig. 5. Delay flowchart symbol
How to draw an effective flowchart
- Define the process boundaries with starting and ending points.
- Complete the big picture before filling in the details.
- Clearly define each step in the process. Be accurate and honest.
- Identify time lags and non-value-adding steps.
- Circulate the flowchart to other people involved in the process to get their comments.
Flowcharts don't work if they're not accurate or if the team is too far removed from the process itself. Team members should be true participants in the process and feel free to describe what really happens. A thorough flowchart should provide a clear view of how a process works. With a completed flowchart, you can:
- Identify time lags and non-value-adding steps.
- Identify responsibility for each step.
- Brainstorm for problems in the process.
- Determine major and minor inputs into the process with a cause & effect diagram.
- Choose the most likely trouble spots with the consensus builder.


 رد مع اقتباس